How to Use Windows Resource Monitor?
The Windows resource monitor is one of the most useful tools in Windows that is quite unknown to users. If you are a hardware enthusiast, then there are some like this resource monitor that can be of great help to you, especially if you are having problems with something and you don’t know exactly where it comes from
In this article, I teach you how to use this Windows resource monitor, and why it can be helpful to you.
The first step is, obviously, accessing this tool. To do this, you can either search for “Resource Monitor” in your Windows search bar or go to the Task Manager and click on the Performance tab. From there, you will see a button labeled “Open Resource Monitor” at the bottom.
What is a resource monitor, and how to use it?
The resource monitor is exactly the definition of its name: a panel where we can monitor the system resources and their utilization. This tool provides us with real-time information about how our CPU, memory, disk, and network are being used.
However, not all the hardware is present; for example, the GPU is missing; we do have the most relevant parts, such as the processor (CPU), memory (RAM), hard drive (whether HDD or SSD), and network (Ethernet/Hardwired or Wi-Fi).
It’s the go-to spot for ensuring everything runs smoothly on our computer, for software errors or irregular processes, as well as inspecting the hardware to prevent potential failures that could impact other components and, most importantly, our productivity when completing tasks.
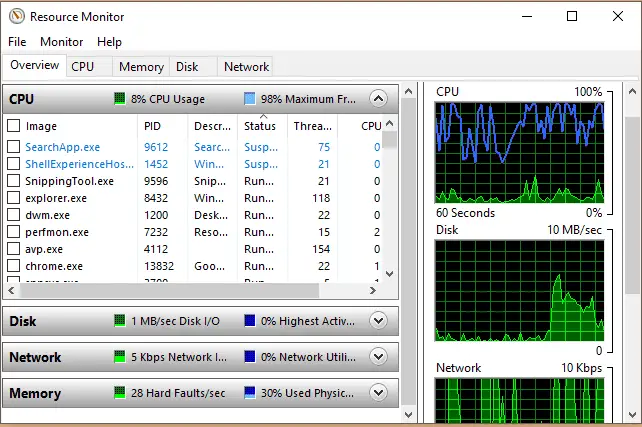
Upon opening the tool, an initial window displays general information regarding the CPU, disk, network, and RAM. On the right-hand side, some graphs show us statistics of use of these four parameters in the last minute.
In this first screen, we can already see general information tab is precisely that at a glance, we have the most relevant of the four sections it deals with.
For more clarity, let’s get into each of the four parameters one by one, starting with the CPU tab, which is one of the important ones to keep in mind.
1. CPU tab
In the CPU tab, some graphs are displayed on the right side, which indicates the utilization of each processor core individually, with the total shown in the first graph.
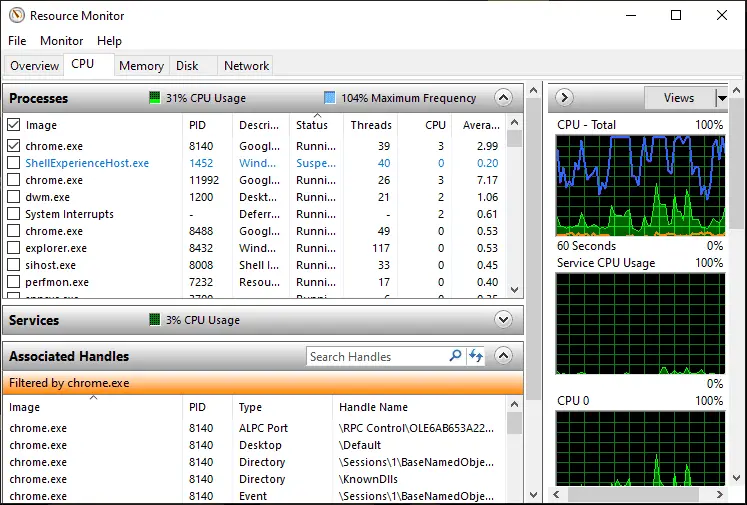
In the “Processes” section, you can find a list of all active processes along with their PID (process ID), thread, CPU usage, and average usage. The exciting thing is, check the box for that process, and the bottom window will only show the activity for that process such as services in use, their identifiers, and associated modules (like as the chrome.exe process in our example).
What is this for? This can be useful to detect which processes or services are maxing out the CPU temp and reducing overall performance. In the event that we have a problem or error on the PC, this section of the resource monitor is ideal to be able to identify and solve it.
Moreover, it incorporates modules linked to the processes, which is handy for identifying resource wastage of threads and cores or potential issues. Additionally, this can be used to check if the program that is running under that name is legitimate since it offers us the full path so that we can control the security of our computer in a slightly more advanced way.
2. Memory tab
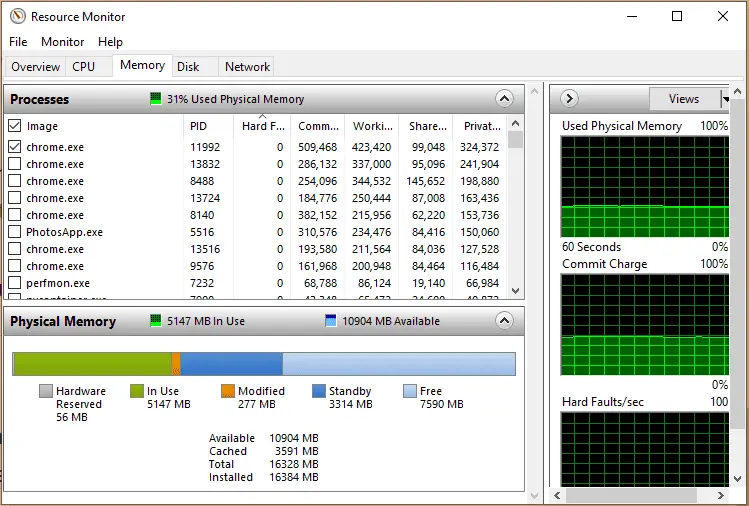
In the Memory tab on the right, we have some graphs that display memory usage, allocation load, and fault indicators. On the left are the processes, with the amount of memory allocated (whether in use or idle).
This section is ideal if your system consumes too much RAM and you don’t know why, helping you identify processes that are consuming more than they should.
If you identify one, you can right-click on it and choose the “End Process” option or the more extreme “End process tree” to terminate all related processes (if it is not essential for the operation of the PC), and that’s it.
This way, you can free up a few precious megabytes or gigabytes to give your computer more RAM joy when performing other tasks.
Similar to the earlier section, you have the option to choose specific processes to check for any delays in the primary process. This allows you to pinpoint the memory usage of all active processes in the system. It’s crucial to note that only processes currently loaded in the RAM are displayed.
Additionally, you can view critical errors identified by Windows. This section, called “Hard Faults/sec,” ideally should be set to zero as a general rule that normally changes value when there is a memory loss or corrected error, indicating that we possibly have a damaged module or module chip.
3. Disk Tab
Here we see on the right the average disk usage in the last minute, with the list of all installed disks or SSDs below. On the left, we find the active processes along with their respective read-and-write statistics. Below, we have the disk activity individualized by process, similar to the RAM tab.
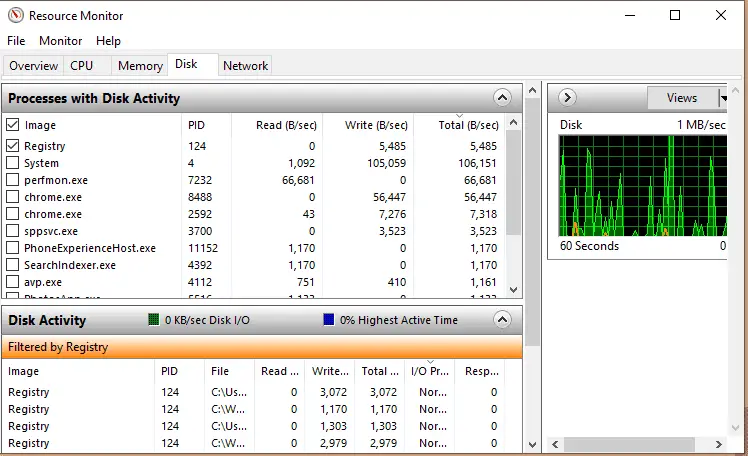
Of course, by selecting the process, you can see how much disk activity it is consuming, including all subprocesses dependent on the main one.
This can be very helpful if we notice that the performance of the SSD or disk is decreased to determine if there is a program or service that is consuming its resources and causing overall speed to go too slow.
Caution is advised when observing active processes in the main view, as a process may initially show low disk activity but reveal a subprocess causing high utilization upon deployment. If you encounter disk usage issues, it is advisable to inspect all processes to identify any problematic threads individually and if you find it, terminate it. At the moment to prevent you from consuming more than you should.
4. Network Tab
Once again, we come across graphs on the right side. These graphs show us the use of the network and the number of TCP connections. This section allows us to see the network resources that are being consumed and how we can filter them.
Moreover, you will also be able to see the IP of the servers to which we are connecting (including gaming servers, and the corresponding ports.
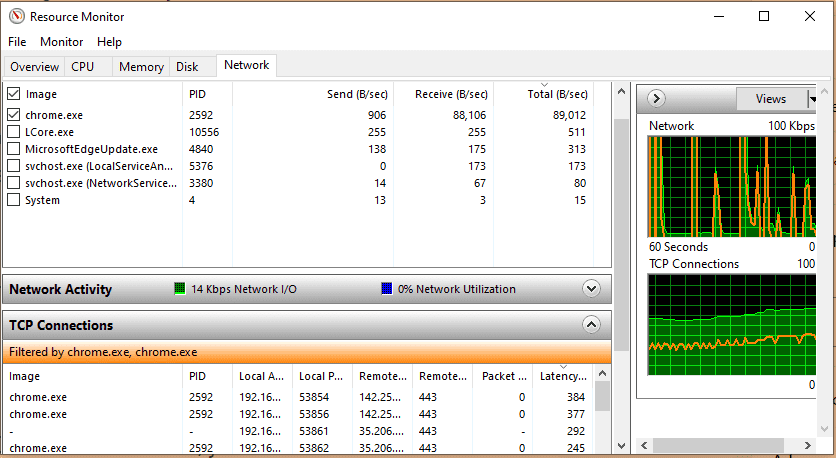
In this regard, it is interesting to note that this is an excellent way to check if the ping you have in online games is high; select the game process, and in the TCP Connections section, you will see both the server’s IP and its port, but also if there is packet loss and, most interestingly, the latency (ping) in milliseconds, represents the delay between you and the game server.
Conclusion about resource monitor
As you can see, the Windows’ resource monitor can be a very powerful tool for diagnosing PC issues, especially for applications that are consuming more resources than they should, and thus be able to tackle any reduction in performance.
While helpful, it could be more foolproof. Depending on the problem, third-party software may be necessary, as well as having to configure various specific sections within the BIOS itself, so try to look for other alternatives that allow you to stay up to date with what is going on within the essential components of the computer if resource monitor alone is not enough for you.